How to interpret F1 score (simply explained)
F1 score is a common classification machine learning metric, but it can be confusing to know how to interpret the values. In this post, I explain what F1 is, how to interpret the values and walk through an example.
F1 score is a common classification machine learning metric, but it can be confusing to know how to interpret the values. In this post, I explain what F1 is, how to interpret the values and walk through an example.
What is F1 score?
F1 score (also known as F-measure, or balanced F-score) is an error metric which measures model performance by calculating the harmonic mean of precision and recall for the minority positive class.
It is a popular metric to use for classification models as it provides accurate results for both balanced and imbalanced datasets, and takes into account both the precision and recall ability of the model.
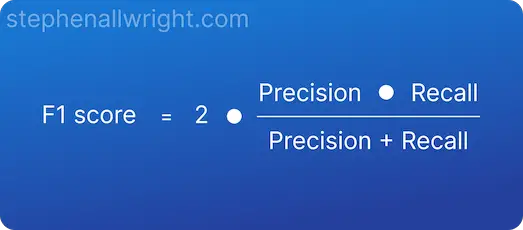
Formula for F1 score
To better understand F1 score, let’s outline its mathematical formula:
How to interpret F1 score
F1 score can be interpreted as a measure of overall model performance from 0 to 1, where 1 is the best. To be more specific, F1 score can be interpreted as the model’s balanced ability to both capture positive cases (recall) and be accurate with the cases it does capture (precision).
F1 score interpretation
Now that we know how to interpret the definition of F1 score, let's look at how to interpret different values. It will be dependent upon your use case and dataset, but a general rule I follow is:
| F1 score | Interpretation |
|---|---|
| > 0.9 | Very good |
| 0.8 - 0.9 | Good |
| 0.5 - 0.8 | OK |
| < 0.5 | Not good |
Example of F1 score interpretation
Let’s look at an example of implementing F1 score and what the subsequent interpretation would be.
In this example I will be using a dataset where we are predicting whether a customer will churn from a service or not:
| Actual | Prediction | Correct? |
|---|---|---|
| False | False | Y |
| True | False | N |
| False | False | Y |
| True | True | Y |
| False | False | Y |
| False | True | N |
| True | True | Y |
The F1 score calculated for this dataset is:
F1 score = 0.67
Let’s interpret this value using our understanding from the previous section.
The interpretation of this value is that on a scale from 0 (worst) to 1 (best), the model’s ability to both capture positive cases and be accurate with the cases it does capture is 0.67, which is commonly seen as an OK value.
How do you interpret F1 scores in classification reports?
In a classification report, you will often receive multiple values for F1 score. You will see the F1 score per class and also the aggregated F1 scores over the whole dataset calculated as the micro, macro, and weighted averages.
The F1 scores per class can be interpreted as the model’s balanced precision and recall ability for that class specifically, whilst the aggregate scores can be interpreted as the balanced precision and recall ability over all classes.
What does F1 score tell you?
F1 score tells you the model’s balanced ability to both capture positive cases (recall) and be accurate with the cases it does capture (precision).
Related articles
Metric calculators
Classification metrics
What is a good F1 score?
How to interpret AUC score
Metric comparisons
F1 score vs AUC, which is the best classification metric?
F1 score vs accuracy, which is the best classification metric?
Micro vs Macro F1 score, what’s the difference?
References