How to interpret MAE (simply explained)
MAE is a common regression machine learning metric, but it can be confusing to know how to interpret the values. In this post, I explain what MAE is, how to interpret the values and walk through an example.
'MAE is a common regression machine learning metric, but it can be confusing to know how to interpret the values. In this post, I explain what MAE is, how to interpret the values and walk through an example.
What is MAE?
MAE (Mean Absolute Error) is the average absolute error between actual and predicted values.
Absolute error, also known as L1 loss, is a row-level error calculation where the non-negative difference between the prediction and the actual is calculated. MAE is the aggregated mean of these errors, which helps us understand the model performance over the whole dataset.
MAE is a popular metric to use as the error value is easily interpreted. This is because the value is on the same scale as the target you are predicting for.
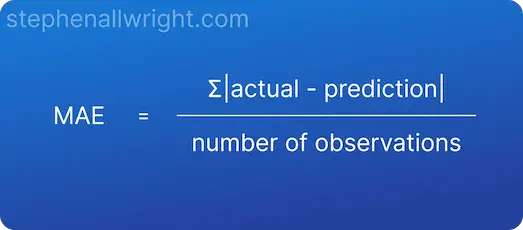
MAE mathematical formula
The formula for calculating MAE is:
How to interpret MAE
MAE is a measure of model accuracy given on the same scale as the prediction target. Simply put, MAE can be interpreted as the average error that the model’s predictions have in comparison with their corresponding actual targets.
MAE value interpretation
The closer MAE is to 0, the more accurate the model is. But MAE is returned on the same scale as the target you are predicting for and therefore there isn’t a general rule for how to interpret ranges of values. The interpretation of your value can only be evaluated within your dataset.
MAE can, however, be developed further by calculating the MAPE (Mean Absolute Percentage Error), which is the MAE returned as a percentage. This can make it easier to interpret model performance and compare values across datasets.
MAE interpretation example
Let’s use our understanding from the previous sections to walk through an example. I will calculate the MAE and subsequent interpretation for an example where we want to predict people’s height.
| Predicted height | Actual height | Actual difference |
|---|---|---|
| 188 | 180 | 8 |
| 180 | 160 | 20 |
| 175 | 170 | 5 |
| 148 | 150 | 2 |
| 203 | 200 | 3 |
| 184 | 190 | 6 |
| 150 | 140 | 10 |
The MAE for these predictions is:
MAE = 7.71
The interpretation of this value is:
The average error between the predictions and actuals in this dataset is 7.71, which is likely a good value considering the average actual height is 170.
Related articles
Regression metrics
How to interpret MAPE
How to interpret R Squared
How to interpret RMSE
How to interpret MSE
Metric comparisons
RMSE vs MAE
MAE vs MAPE
MSE vs MAE
Metric calculators
References