How to interpret MSE (simply explained)
MSE is a common regression machine learning metric, but it can be confusing to know how to interpret the values. In this post, I explain what MSE is, how to interpret the values and walk through an example.
MSE is a common regression machine learning metric, but it can be confusing to know how to interpret the values. In this post, I explain what MSE is, how to interpret the values and walk through an example.
What is MSE?
Mean Squared Error (MSE) is the average squared error between actual and predicted values.
Squared error, also known as L2 loss, is a row-level error calculation where the difference between the prediction and the actual is squared. MSE is the aggregated mean of these errors, which helps us understand the model performance over the whole dataset.
The main draw for using MSE is that it squares the error, which results in large errors being punished or clearly highlighted. It’s therefore useful when working on models where occasional large errors must be minimised.
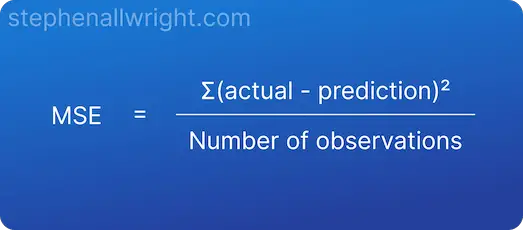
MSE mathematical formula
The formula for calculating MSE is:
How to interpret MSE
MSE should be interpreted as an error metric where the closer your value is to 0, the more accurate your model is. However, MSE is simply the average of the squared errors, meaning the resulting value will unfortunately not be understood within the context of your model target.
MSE value interpretation
There is no general rule for how to interpret given MSE values. It is an absolute value which is unique to each dataset and can only be used to say whether the model has become more or less accurate than a previous run.
MSE interpretation example
Let’s use our understanding from the previous sections to walk through an example. I will calculate the MSE and subsequent interpretation for an example where we want to predict people’s height.
| Predicted height | Actual height | Squared difference |
|---|---|---|
| 188 | 180 | 64 |
| 180 | 160 | 400 |
| 175 | 170 | 25 |
| 148 | 150 | 4 |
| 203 | 200 | 9 |
| 184 | 190 | 36 |
| 150 | 140 | 100 |
The MSE for these predictions is:
MSE = 91.14
The interpretation of this value is:
The average squared error for the predictions is 91.14, which can be used as a baseline to see if model accuracy improves over time or not. In order to truly interpret model accuracy, we should look at alternative metrics such as RMSE or MAE.
Related articles
Regression metrics
How to interpret MAPE
How to interpret R Squared
How to interpret RMSE
How to interpret MAE
Metric comparisons
MSE vs MAE, which is the better regression metric?
RMSE vs MSE, what's the difference?
Metric calculators
References