RMSE vs MAPE, which is the best regression metric?
RMSE and MAPE are machine learning metrics used to measure the performance of regression models. They’re common metrics to use, but how do you know which is best for your use case? In this post I will explain what they are, their similarities and differences, and which you should use.
RMSE and MAPE are machine learning metrics used to measure the performance of regression models. They’re common metrics to use, but how do you know which is best for your use case? In this post I will explain what they are, their similarities and differences, and which you should use.
What are RMSE and MAPE?
To start with, let’s lay some groundwork and first define what RMSE and MAPE are.
What is RMSE?
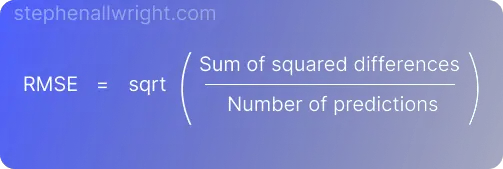
Root Mean Squared Error (RMSE) is the square root of the mean squared error between the predicted and actual values.
A benefit of using RMSE is that the metric it produces is in terms of the unit being predicted. For example, using RMSE in a house price prediction model would give the error in terms of house price, which can help end users easily understand model performance.
The formula for calculating RMSE is:
What is MAPE?
Mean Absolute Percentage Error (MAPE) is the mean of all absolute percentage errors between the predicted and actual values.
It is a popular metric to use as it returns the error as a percentage, making it both easy for end users to understand and simpler to compare model accuracy across use cases and datasets.
The formula for calculating MAPE is:
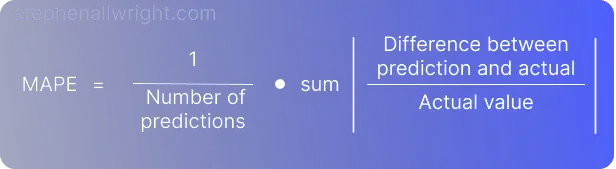
This formula helps us understand one of the important caveats when using MAPE. In order to calculate this metric we need to divide the difference by the actual value. This means that if you have actual values close to or at 0 then your MAPE score will either receive a division by 0 error, or be extremely large. Therefore, it is advised not to use MAPE when you have actual values close to 0.
Similarities and differences of RMSE and MAPE
Now that we have defined what RMSE and MAPE are, let’s look at what makes them similar and what their differences are.
What are the similarities between RMSE and MAPE?
- Both are used for regression models
- Both are all-round metrics which give a good indication of general model performance
- Both are easily implemented in Python using the scikit-learn package
What are the differences between RMSE and MAPE?
- RMSE is more sensitive to outliers than MAPE
- MAPE returns the error as a percentage whilst RMSE is an absolute measure in the same scale as the target
- MAPE is much more understandable for end users than RMSE due to it being a percentage
- RMSE can be used on any regression dataset, whilst MAPE can’t be used when actual values are close to 0 due to the division by 0 error
When should you use MAPE or RMSE?
RMSE and MAPE are both metrics for regression models, but given the similarities and differences we have just seen, when should you use MAPE or RMSE?
The main factors that determine whether you should use MAPE or RMSE relate to the model you are training, the dataset you have created, and to what extent end users are involved in the process.
The model
Machine learning models use an error metric to guide their optimisation during the training process. It is common to track the same metric that is being used for this optimisation to better understand model development over time.
A common metric to use for this optimisation is RMSE, whilst MAPE is rarely used for this situation. Therefore, if your model is optimising for RMSE then it would make sense to track this rather than MAPE.
The dataset
We saw previously that MAPE can suffer from a division by 0 error. Therefore, if your dataset has actual values around 0 you are unable to use MAPE and therefore would need to use RMSE.
The end users
MAPE is much more understandable than RMSE. Therefore, if you need to convey model performance to end users, especially to those who aren’t data professionals, then MAPE would be the better choice as this is calculated as an easy to understand percentage.
RMSE vs MAPE, which is better?
RMSE and MAPE are both good all-round metrics, so it would be best to track both. However, if you have to choose one then MAPE is the preferred choice as it’s calculated as a percentage which makes it easy to understand for both developers and end users alike. A caveat to this though is when your dataset has actual values close to 0, where calculating MAPE is not possible, and therefore RMSE would be the best choice.
Related articles
Regression metrics
Interpret MAPE values
Interpret RMSE values
Regression metric comparisons
RMSE vs MAE
RMSE vs MSE
MAE vs MAPE
Metric calculators
RMSE calculator
MAPE calculator
References
RMSE scikit-learn documentation
MAPE scikit-learn documentation