What is a good R-Squared value? (simply explained)
R-Squared is a metric used in machine learning and statistics, but it can be confusing to know what a good value is. In this post, I explain what R-Squared is, how to calculate it, and what a good value actually is.
R-Squared is a metric used in machine learning and statistics, but it can be confusing to know what a good value is. In this post, I explain what R-Squared is, how to calculate it, and what a good value actually is.
What is R-Squared in machine learning?
R-Squared is a metric for assessing the performance of regression machine learning models. Unlike other metrics, such as MAE or RMSE, it is not a measure of how accurate the predictions are, but instead a measure of fit. R-Squared measures how much of the dependent variable variation is explained by the independent variables in the model.
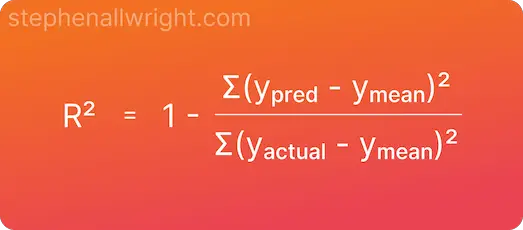
R-Squared mathematical formula
The formula for calculating R-Squared is as follows:
What is the difference between R-Squared and R2?
R2 score and R-Squared are the same metrics, but the naming difference arises from the popular Python package scikit-learn. This package, which is commonly used for metrics by developers, has a function called r2_score which calculates the R-Squared value.
How do I calculate R-Squared in Python?
R-Squared, or R2 score, is straightforward to implement in Python by using the scikit-learn package. Below you will find a simple example:
from sklearn.metrics import r2_score

y_true = [12, -5, 4, 1]
y_pred = [11.5, -1, 5.5, 0]

r_squared = r2_score(y_true, y_pred)
What is a good R-Squared value?
R-Squared is a measure of fit where the value ranges from 1, where all variance is explained, to 0 where none of the variance is explained. Of course, how good a score is will be dependent upon your use case, but in general R-Squared values would be interpreted as:
| R-Squared value | Interpretation |
|---|---|
| 0.75 - 1 | Significant amount of variance explained |
| 0.5 - 0.75 | Good amount of variance explained |
| 0.25 - 0.5 | Small amount of variance explained |
| 0 - 0.25 | Little to no variance explained |
Can R-Squared values be compared across models?
R-Squared cannot be used to compare models from different datasets as the variance found in one dataset is not comparable with others.
Is a higher R-squared value good?
The higher the R-Squared value the better. Higher values imply that more of the variation in the dependent variable is explained by the independent variables in the regression model.
What is a low R-squared?
The lowest R-Squared value is 0 (although it can also be negative too), but a low R-Squared value is often considered to be anything below 0.25 which would indicate little to no variation is explained by the independent variables.
What does it mean if R-squared is 1?
If the R-Squared value is 1 then this indicates that all the variation of the dependent variable is explained by the independent variables. In real-world use cases, it is incredibly rare to achieve a value of 1.
Is an R-squared value of 0.5 good?
Whether or not a score is good depends on the use case, but in general, an R-Squared value of 0.5 would be seen as OK. This would indicate that half of the dependent variable variance is explained by the model’s independent variables.
What R-Squared value is considered a strong correlation?
An R-squared value of above 0.75 would be considered a strong correlation for most use cases.
Related articles
Regression metrics
What is a good MSE value?
What is a good MAPE score?
What is MDAPE?
Interpret R Squared
Metric calculators
R squared calculator
Coefficient of determination calculator
References