How to interpret AUC score (simply explained)
AUC score is a common classification machine learning metric, but it can be confusing to know how to interpret the values. In this post, I explain what AUC is, how to interpret the values and walk through an example.
AUC score is a common classification machine learning metric, but it can be confusing to know how to interpret the values. In this post, I explain what AUC is, how to interpret the values and walk through an example.
What is AUC score?
AUC is a common abbreviation for Area Under the Receiver Operating Characteristic Curve (ROC AUC). It’s a metric used to assess the performance of classification machine learning models.
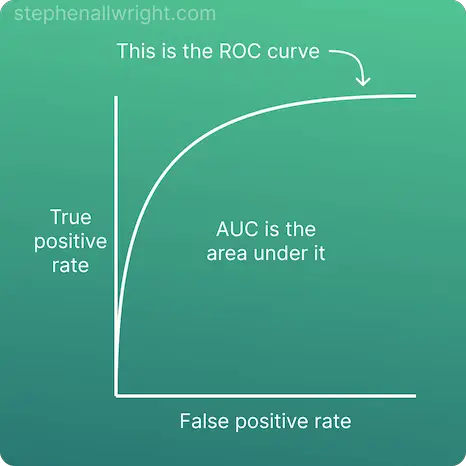
The ROC is a graph which maps the relationship between true positive rate (TPR) and the false positive rate (FPR), showing the TPR that we can expect to receive for a given trade-off with FPR. The AUC score is the area under this ROC curve, meaning that the resulting score represents in broad terms the model's ability to predict classes correctly.
AUC score formula
To better understand how AUC score is calculated, let’s look at an easy-to-understand visualisation:
How to interpret AUC score
AUC score is interpreted as the probability that the model will assign a larger probability to a random positive observation than a random negative observation. More simplistically, AUC score can be interpreted as the model’s ability to accurately classify classes on a scale from 0 to 1, where 1 is best and 0.5 is as good as random choice.
For example, an AUC score of 0.9 would imply that the model is very likely to assign larger probabilities to random positive examples than random negatives. However, an AUC score of 0.5 would imply that the model is only as good as random choice when assigning probabilities to examples.
AUC score interpretation
Now that we understand how to interpret the meaning of AUC, let’s look at how to interpret the different values that it can produce. This will be dependent upon your use case and dataset, but a general rule that I follow is:
| AUC score | Interpretation |
|---|---|
| >0.8 | Very good performance |
| 0.7-0.8 | Good performance |
| 0.5-0.7 | OK performance |
| 0.5 | As good as random choice |
Does AUC represent accuracy?
AUC isn’t a direct measure of model accuracy, it’s the probability that the model will assign a larger probability to a random positive example than a random negative. However, it can be interpreted as a form of accuracy where the higher the score the more likely that correct predictions will be made.
AUC score interpretation example
Let’s use our understanding from the previous sections to walk through an example. In this example I will be calculating the AUC score and subsequent interpretation for this simple classification dataset:
| Actual | Prediction | Correct? |
|---|---|---|
| 0 | 0 | Y |
| 1 | 0 | N |
| 0 | 0 | Y |
| 1 | 1 | Y |
| 0 | 0 | Y |
| 0 | 1 | N |
| 1 | 1 | Y |
The AUC score for these predictions is:
AUC score = 0.71
The interpretation of this value is:
The probability that the model will assign a larger probability to a random positive example than a random negative example is 0.71, which is commonly seen as a good value.
Related articles
Classification metrics
What is a good AUC score?
How to interpret F1 score
Metric comparisons
AUC vs accuracy, which is the best metric?
F1 score vs AUC, which is the best classification metric?
References