MAE vs MAPE, which is best?
MAE and MAPE are machine learning metrics for regression models. Both metrics are built on the same calculation, so it’s often confusing to know whether you should use one of the other. In this post I will explain the similarities, differences, and hopefully help you find out which you should use.
MAE and MAPE are machine learning metrics for regression models. Both metrics are built on the same calculation, so it’s often confusing to know whether you should use one of the other. In this post I will explain the similarities, differences, and hopefully help you find out which you should use.
MAE vs MAPE
MAE (Mean Absolute Error) is the mean absolute difference between the actual and the predicted value, whilst MAPE (Mean Absolute Percentage Error) is the mean absolute percentage difference between the actual and the predicted value. Therefore, the key difference is that MAPE is returned as a percentage instead of an absolute value, as with MAE.
MAE and MAPE mathematical definitions
This difference can be seen more clearly when looking at the mathematical formulas for the two metrics:

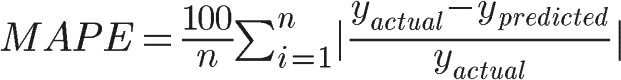
You can see that both MAE and MAPE use the absolute difference between the actual and the predicted, but MAPE takes this difference and turns it into a relative percentage by diving by the actual and multiplying by 100.
Calculating MAE and MAPE
Now that you have learned a little more about MAE and MAPE let’s look at an example of them in practice.
To calculate MAE and MAPE you need to take the following steps:
- Calculate the absolute difference and percentage difference between the actual and prediction for each observation
- Calculate the mean of the absolute differences for MAE and the mean of the percentage differences for MAPE
Let’s implement these steps in an example using a house price prediction model.
First we will calculate the absolute and percentage differences:
| Predicted price | Actual price | Absolute difference | Percentage difference |
|---|---|---|---|
| 100,000 | 105,000 | 5,000 | 4.8% |
| 120,000 | 118,000 | 2,000 | 1.7% |
| 160,000 | 170,000 | 10,000 | 5.9% |
Now we have the differences for each observation we can calculate the MAE and MAPE like so:
#MAE
(5000 + 2000 + 10000) / 3 = 5,667

#MAPE
(4.8 + 1.7 + 5.9) / 3 = 4.1%
Use MAE and MAPE in Python
Both MAE and MAPE are easily implemented in Python using the sklearn package. The syntax for using them is:
from sklearn.metrics import mean_absolute_percentage_error, mean_absolute_error

actual = [10,12,8]
prediction = [9,14.5,8.2]

mae = mean_absolute_error(actual, prediction)
mape = mean_absolute_percentage_error(actual, prediction)
Similarities between MAE and MAPE
Given that MAPE is a further development of the MAE calculation, there are some key similarities between them. These are:
- Both aren’t sensitive to outliers as they use the absolute difference
- Both are widely used and easily implemented in Python using sklearn
Differences between MAE and MAPE
Whilst being based on a similar calculation, MAE and MAPE do have some differences which could be of importance for your use case:
- MAPE is more understandable than MAE for end users as it is given as a percentage
- MAE varies in scale depending on the target you are predicting for, making it difficult to compare across models. This is a problem that MAPE does not have as it is given as a percentage
- MAPE can’t be used with actual values close to or at 0 otherwise a division by 0 error will occur. MAE on the other hand can be used in this situation as there is no division
MAE or MAPE, which is better?
It is good practice to track multiple metrics when developing a model, so it would be ideal to track both of these. But, what should you do if you had to choose only one?
In most use cases MAPE is better than MAE, this is for two reasons. The first is that the percentage makes it easy to understand for both developers and end users, and the second is that MAPE scores can be compared across different models. However, if your actual values can be close to or at 0, then MAE would be the preferred choice.
Related articles
How to interpret the meaning of MAPE
How to interpret the meaning of MAE
Regression metrics
What is a good MAE score?
What is a good MAPE score?
What is MDAPE?
Metric comparisons
RMSE vs MAE, which should I use?
RMSE vs MAPE, which is the best regression metric?
MSE vs MAE, which is the better regression metric?
Metric calculators
References